How to Build an AI Search Benchmark Dashboard When Your Competitors Are Measuring AEO Performance Across 10 Industry Categories and You're Still Tracking Google Rankings
How to Build an AI Search Benchmark Dashboard When Your Competitors Are Measuring AEO Performance Across 10 Industry Categories and You're Still Tracking Google Rankings
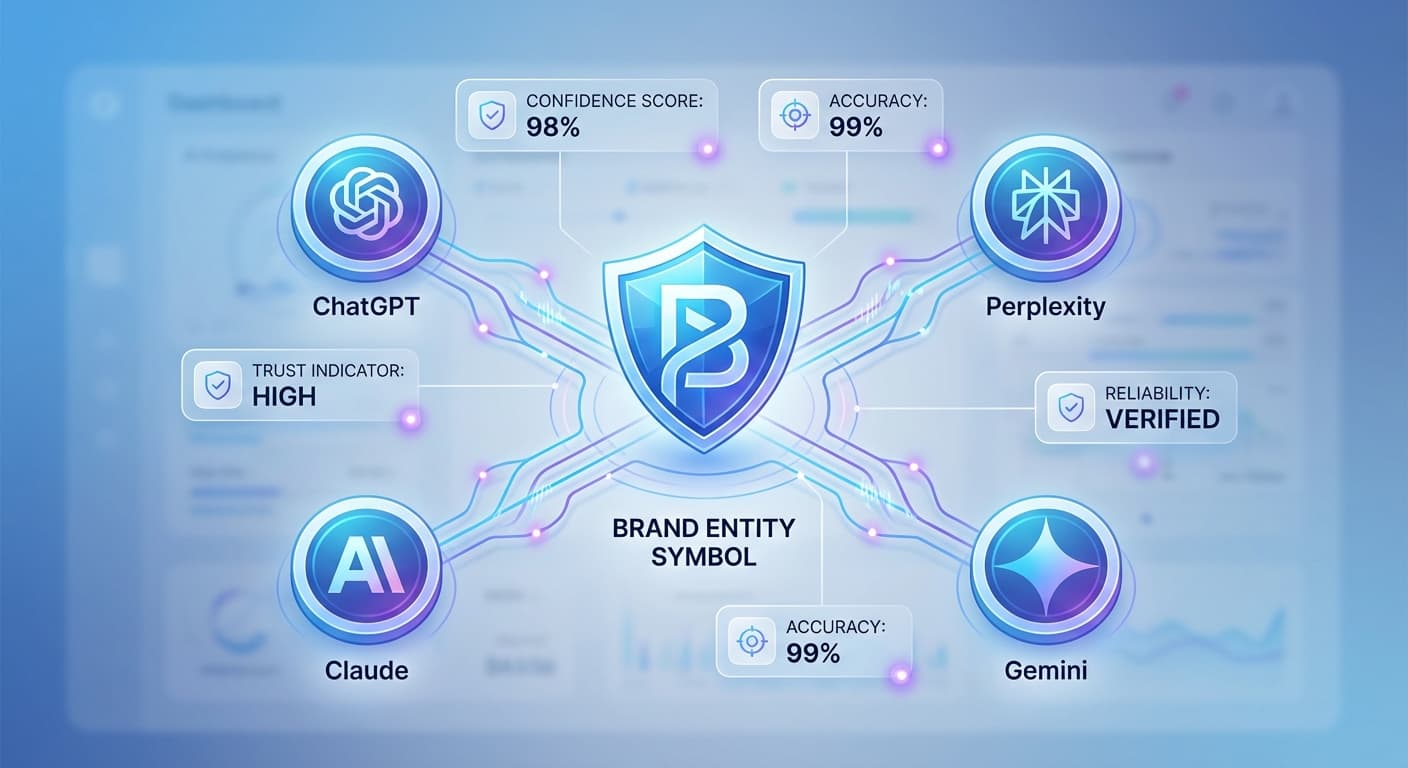
While you're celebrating that #3 Google ranking, your competitors are already dominating the AI search landscape that now handles over 35% of all search queries in 2026. They're tracking their Answer Engine Optimization (AEO) performance across multiple industry categories, measuring citation rates in ChatGPT, Perplexity, Claude, and Gemini—while you're still stuck in the traditional SEO mindset.
The harsh reality? With over 600 million weekly active users on ChatGPT alone and 78% of Gen Z now using AI for research, your Google rankings mean less every day. It's time to build a comprehensive AI search benchmark dashboard that actually measures what matters in 2026.
Why Traditional SEO Metrics Are Failing Businesses in 2026
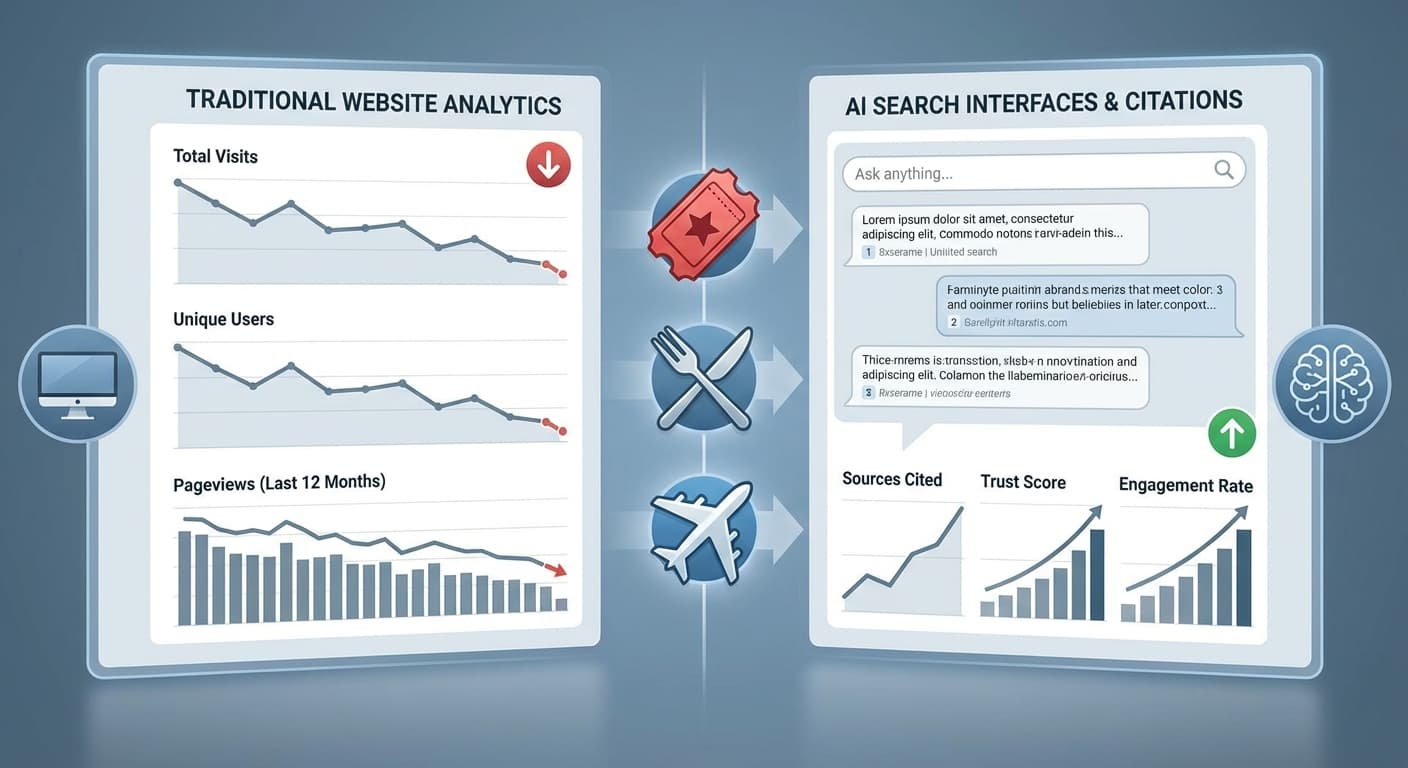
The digital marketing landscape has fundamentally shifted. While traditional search engines still matter, the explosion of AI-powered search has created an entirely new battleground for visibility. Here's what's changed:
Your competitors aren't just ahead—they're playing an entirely different game. They're measuring AEO performance, tracking citation rates, and optimizing content specifically for AI engines across multiple industry verticals.
Understanding AEO Performance Metrics That Actually Matter
Before building your dashboard, you need to understand what AEO metrics provide actionable insights:
Core AEO Metrics to Track
Industry Category Performance
Successful competitors track AEO performance across at least 10 industry categories because AI engines categorize and serve information differently based on context. For example:
Building Your AI Search Benchmark Dashboard: A Step-by-Step Framework
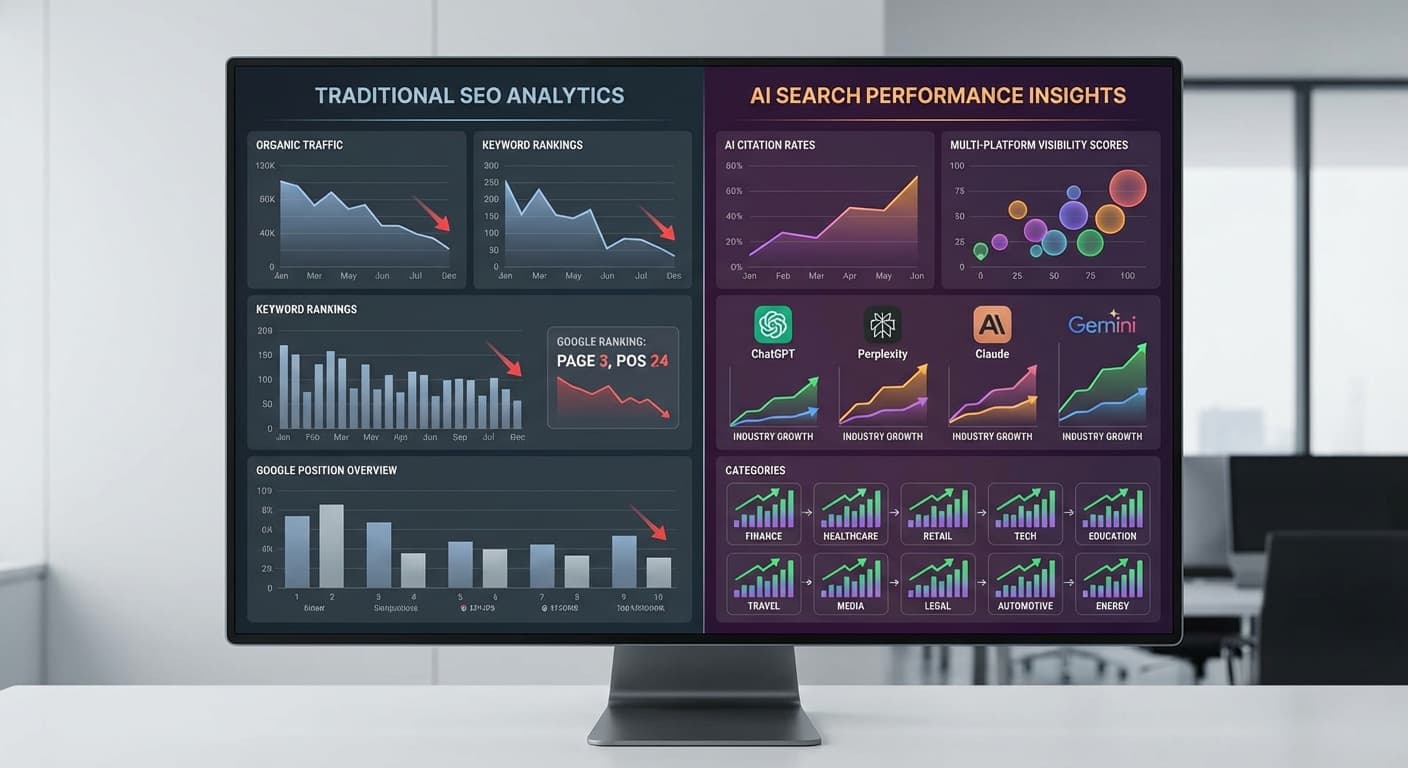
Phase 1: Define Your Baseline Metrics
Start by establishing what you're currently measuring versus what you should be measuring:
Traditional Metrics (Still Important):
AI Search Metrics (Critical for 2026):
Phase 2: Industry Category Mapping
Identify the 10 most relevant industry categories for your business. Common high-performance categories include:
For each category, establish baseline metrics and competitive benchmarks.
Phase 3: Data Collection Infrastructure
Building an effective dashboard requires multiple data sources:
Primary Data Sources:
Secondary Data Sources:
Phase 4: Competitor Analysis Framework
Create a systematic approach to understanding how competitors dominate AI search:
Content Analysis:
Platform Performance:
Tools like Citescope Ai can accelerate this process by automatically analyzing competitor content across the five key dimensions that AI engines evaluate: interpretability, semantic richness, conversational relevance, structure, and authority.
Advanced Dashboard Features for Competitive Intelligence
Real-Time Citation Monitoring
Your dashboard should include real-time tracking of when and how your content (and competitors' content) gets cited. Key features:
Content Gap Analysis
Identify opportunities where competitors are getting cited but you're not:
Performance Prediction Models
Use historical data to predict which content types and topics are most likely to get citations:
How Citescope Ai Helps Build Your AI Search Dashboard
While building a comprehensive AI search dashboard manually is complex and time-consuming, Citescope Ai streamlines the entire process:
GEO Score Analysis: Get instant visibility into how your content performs across the five key dimensions AI engines evaluate, with scores from 0-100 that directly correlate with citation potential.
Citation Tracker: Monitor in real-time when your content gets cited by ChatGPT, Perplexity, Claude, and Gemini—eliminating the manual tracking burden and providing the competitive intelligence you need.
AI Rewriter: One-click optimization that restructures your existing content based on what actually gets cited, helping you close performance gaps with competitors quickly.
Multi-Format Export: Download optimized content as Markdown, HTML, or WordPress blocks, ensuring your dashboard insights translate into actionable content improvements.
Measuring Success: KPIs That Drive Business Results
Your AI search benchmark dashboard should ultimately drive business outcomes. Focus on these key performance indicators:
Primary KPIs
Secondary KPIs
Implementation Timeline and Resource Planning
Building an effective AI search benchmark dashboard isn't an overnight project. Here's a realistic timeline:
Month 1-2: Foundation setup, baseline metrics, competitor identification
Month 3-4: Data collection infrastructure, initial content optimization
Month 5-6: Advanced analytics, prediction models, competitive intelligence
Month 7+: Continuous optimization, scaling across categories, ROI measurement
Ready to Optimize for AI Search?
While your competitors race ahead with sophisticated AI search strategies, you don't have to start from scratch. Citescope Ai provides the tools and insights you need to build an effective AI search benchmark dashboard quickly.
Get started with our free tier (3 optimizations per month) to see how your content performs against AI search criteria, or jump to our Pro plan ($39/month) for comprehensive citation tracking and optimization across all major AI platforms.
Start measuring what actually matters in 2026—try Citescope Ai today and stop letting competitors dominate the AI search landscape while you're still celebrating Google rankings.